Sunday, April 30, 2006

Game 22 - 4/30/2006

A's 13, Royals 6

Mark Elarton had pitched well for the Royals this season, until today's game. Elarton couldn't find his control and he gave up 5 runs in just 2 1/3 innings. It's becoming all too common for Buddy bell to have to replace his starter in the early innings.

Things were a bit encouraging when the Royals were able to tie the game at five on Mark Teahen's home run in the fifth inning. But as has been the case so many times this season, just as the Royals seem to gain some momentum, they immediately give it up.

It happened today when Bell again called on the struggling Luke Hudson to pitch the sixth inning. Hudson gave up four runs without recording an out.

But what really sealed the deal was Esteban German's error in center field. German took his position on a partly sunny day sans sunglasses. Nick Swisher hit a fly ball to center and German seemed to get under it to make the catch. But instead, the ball hit German in the face, giving him a fat lip. It was just another embarrassing moment in an embarrassing season.

Next up, the Royals will hit the road in search of their first road win of the season.

The Bell Curve


Actual Record: 5-17
Expected Record: 6-16
Runs Scored: 83
Runs Allowed: 139
Projected Record: 37-125
Pythagorean Record: 43-119
Pythagorean Winning %: .263

Let's go get 'em.

Saturday, April 29, 2006

Game 21 - 4/28/2006

A's 5, Royals 3

Ouch. The injuries keep piling up. Pitchers Denny Bautista, Mike MacDougal, Runelvys Hernandez, Mark Redman, Steve Stemle, and Zack Greinke have all spent time on the DL. Center fielder David DeJesus is on the DL with a bad hamstring. In this game, Shane Costa hurt his hamstring and Mike Sweeney wrenched his back while twisting away from a pitch up and in.

Injuries have been a problem for the Royals for the last few years. Will Caroll's "Under The Knife" columns at Baseball Prospectus study the affect of injuries, and Carroll has shown that injuries can be avoided. While criticism of the General Manager, Manager and even owner are fair, the Royals should focus their efforts on injury prevention. Is the strength and conditioning one of the areas where the Royals are cutting costs?

The Bell Curve


Actual Record: 5-16
Expected Record: 6-15
Runs Scored: 77
Runs Allowed: 126
Projected Record: 39-123
Pythagorean Record: 44-118
Pythagorean Winning %: .272

Let's go get 'em.

Breaking 100: Offensive Wasteland

One month into the season, the Royals’ hopes of avoiding 100 losses are quickly fading. Their pitching has been inconsistent, and injuries are decimating their roster.

With the additions of Grudzeilanek, Sanders, and Meintkeiwicz, and the return of Sweeney, Brown and DeJesus, the Royals had hoped to boost their offense this season. A quick look at the stats shows that the plan is not working.

Stat Royals MLB Rank
Runs 77 30
Hits 165 29
Doubles 41 15
Triples 6 7
Home Runs 13 30
RBI 73 30
Total Bases 260 29
Walks 50 29
Strike Outs 142 17
Stolen Bases 8 24
OBP .300 30
SLG .378 29
AVG .245 26

Baseball people like to say that you win with pitching and defense. It stands to reason that if your pitching and defense are solid, you can get by with a below average offense. But when you’re next to last in the majors in ERA, and your offense is at or near the bottom of the majors, it can only spell losses. And the Royals are piling up the losses quickly.

Let’s go get 'em.

Thursday, April 27, 2006

Game 20 - 4/27/2006

Twins 7, Royals 3

Mark Redman struggled in the second inning, giving up 5 runs - enough to allow the Twins to coast to a victory. The Royals called upon Mike Wood after just 1 2/3 innings.

The only noise the Royals could make against Johan Santana was Berroa's solo homer in the second and they were able to string together some hits on a tiring Santana in the eighth.

The A's come in town for a three game weekend series. Hopefully the good pitching the Royals have enjoyed over the last week will return.

The Bell Curve

Actual Record: 5-15
Runs Scored: 74
Runs Allowed: 121
Projected Record: 41-121
Pythagorean Record: 44-118
Pythagorean Winning %: .272

Let's go get 'em.

Wednesday, April 26, 2006

Game 19 - 4/26/2006

Twins 1, Royals 3

Wow! Royals fans got a nice surprise tonight. Starter Runevlys Hernandez, who entered Spring Training some 50 pounds overweight and spent the first 3 weeks of the season in Omaha getting in shape, got his first start for the Royals. He surprised all by pitching 7 outstanding innings, giving up 2 hits, no walks and just one run.

This is nothing like the Hernandez who made 3 sub-par starts in Omaha. For the record, this makes 4 straight good outings by Royals pitchers. Joe Mays pitched well on Saturday but left before qualifying for the win. Jeremey Affeldt looked fantastic Sunday and Elarton pitched great last night but with no run support. We have reason to be optimistic with the improved pitching and better overall play of the Royals.

However, the run deficit still has the Pythagorean Formula at over 100 losses. We could use a nice 10 run blowout tomorrow afternoon to finish out the Twins series.

The Bell Curve

Actual Record: 5-14
Runs Scored: 71
Runs Allowed: 114
Projected Record: 43-119
Pythagorean Record: 45-117
Pythagorean Winning %: .279

Let's go get 'em.

Game 18 - 4/25/2006


Twins 2, Royals 1
The cold and rain wasn't going to keep us away from our free David DeJesus t-shirts. After a 40 minute rain delay, things finally got underway. Scott Elarton pitched well, pitching 7 scoreless innings. He got out of a jam in the seventh when he was obviously tiring.

Bell made a questionable move by bringing in Luke Hudson to pitch in the eighth while clining to a 1-0 lead. Hudson gave up 3 straight hits, giving up a run. Bell then summoned Andy Sisco who allowed one of Hudson's runners to score, giving up the lead.

The biggest story of this game was the missed opportunities. The Royals left 14 on base and had the bases loaded twice but could only muster one run. Kyle Lohse wasn't pitching well, but the Royals couldn't put up together enough hits to get those runs in. Elarton, once again, was the victim of poor run support. He got a no decision even though he pitched a great game.

The Bell Curve


Actual Record: 4-14
Runs Scored: 68
Runs Allowed: 113
Projected Record: 36-126
Pythagorean Record: 43-119
Pythagorean Winning %: .266

Let's go get 'em.

Tuesday, April 25, 2006

Breaking 100: History on our Side

Last week, I was getting nervous. The Royals were finished up an 0-9 road trip and were working on an 11 game losing streak.

I wanted to do some research about teams that have slow starts. I was curious to know whether teams that start 2-12 have historically been able to avoid 100 losses. I started doing some research, but since I didn't have all of the data readily available, I decided to turn to the SABR mail list. (If you are interested in baseball research, I suggest you join SABR.) Gerry Myerson chimed in with the following list of teams that started 2-12:

PIT sched 1952 42-112 8
DET sched 2002 55-106 5
NYG sched 1951 98-59 1 NL Pennant
NYY sched 1913 57-94 7
ATL sched 1988 54-106 6
NYG sched 1916 86-66 4
DET sched 1953 60-94 6
ATL sched 1990 65-97 6
SLB sched 1935 65-87 7
ARI sched 1998 65-97 5
BRO sched 1927 65-88 6
BOS sched 1996 85-77 3
DET sched 1959 76-78 4
WSA sched 1962 60-101 10
STL sched 1973 81-81 2
NYM sched 1962 40-120 10
PHA sched 1951 70-84 6
CHW sched 1968 67-95 9
CIN sched 1931 58-96 8
SDP sched 1987 65-97 6

This was helpful. Of that list of 20 teams, only 5 of them lost 100 or more games.

Then Frank Vaccaro then submitted the following information:

A low amount of scheduled games in the regular season meant teams
starting 2-12 from 1871 to 1888 really had little or no chance of losing 100
games. Ten teams prior to 1889 opened the season 2-12: 1872 BKNna, 1872
ECK-na, 1873 NYna, 1874 BALna, 1875 PHI-Cna, 1875 WASna, 1875 BKNna, 1884
ALTu, 1884 PHIu, and 1888 WASn. Most of those teams had final winning
percentages of less than .250 which is comparable to the 40-120 New York
Mets. The 1873 New York Mutuals, in a season tinged with gambling
accusations, finished the season over .500, 29-24.

So, considering all 2-12 starting teams post-1888, of twenty-four teams
in the 2-12 start club (20 clubs posted by Gary Myerson yesterday along with
1889 LOUaa, 1904 PHIn, 1904 WASa, and 1913 CINn) eight have lost 100 games
giving this year's Kansas City club an historically based 33 percent chance
of losing in triple digits.

Good performances after the 2-12 start include the 1951 NYn pennant, a
38-18 finish for the 1996 Red Sox which put them over .500 and final week
eliminations for both the 1916 NYn and the 1973 STLn. The 1959 DETa could
have been the fifth to finish at or above .500, but on the final day of the
season rookie pitcher Bob Bruce lost in his MLB debut. The bell curve of the
final winning percentages for the post-1888 teams is as follows:

.600- 1951 NYn
.550- 1916 NYn
.500- 1996 BOSa 1973 STLn
.450- 1959 DETa 1951 PHIa
.400- 1935 STLa 1927 BKNn 1913 CINn 1968 CHIa 1987 SDn 1990 ATLn 1998 ARZn
.350- 1953 DETa 1913 NYa 1931 CINn 1962 WASa
.300- 1904 PHIn 2002 DETa 1988 ATLn
.250- 1952 PITn 1904 WASa 1962 NYn
.200-
.150- 1889 LOUaa

Anyway, Kansas City is now 2-13 and hosts Cleveland at 7:00 pm tonight.
They can become either the 54th team to be 3-13 or the 21st team to go 2-14.
Interestingly, the 39 post-1888 teams that opened 3-13 finished the season
with an aggregate average won loss percentage of .371. The 8 post-1888 teams
that opened the year 2-14 finished the year with an aggregate average won
loss percentage of .420. So, historically, if the Royals lose today, they're
in better company. (Either things like this happen with an eight team sample
size, or teams make more drastic changes due to poorer starts.)

(For this final stat I did not include four "non-qualifying teams"
teams: the 1981 CHIn who were 2-14 in the first half, and three 3-13 teams:
the second halvers 1892 STLn and 1981 SDn, and the 1890 BKNaa team which
disbanded mid-year.)

This information is helpful. It looks like, based on the Royals' 2-12 start, they still had a 66% chance of avoiding 100 losses. And given their new winning streak, things should be looking up even more today.

Let's go get 'em.

Monday, April 24, 2006

Game 17 - 4/23/2005

Indians 1, Royals 5

Two in a row. It's a start. And the great thing about this game was the fact that Jeremy Affeldt finally seems to be getting in a groove. Affeldt pictched a great game, going 5.1 innings and giving up only 1 run and striking out a season high six.

The Royals had another good day offensively, triggering the Krispy Kreme donut giveaway (12 hits) for the second time in three games. They took advantage of mistakes by the Indians defense to get three runs in the second inning, and added insurance runs in the fourth and eighth. Elmer Dessens had another good outing giving up just two hits in 2.1 innings. Sisco and Burgos finished out the game.

The Royals have won 2 in a row despite some baserunning blunders. Beyond the base running, they have played solid baseball all around - pitching, defense and hitting.

After an off day Monday, we'll be at the ball park Tuesday night to see the Royals try to push the streak to 3 against the Twins.

The Bell Curve

Actual Record: 4-13
Runs Scored: 67
Runs Allowed: 111
Projected Record: 38-124
Pythagorean Record: 43-119
Pythagorean Winning %: .267

Let's go get 'em.

Game 16 - 4/22/2006

Indians 5, Royals 11

Things looked good from the start. Royals starter Joe Mays got through the top of the first unscathed, and the Royals then got things rolling with 4 runs in the bottom of the first off of Indians starter and former Royal Paul Byrd.

The offense kept the pressure on by scoring two in the second and one in the third. Mays missed out on the victory after he faltered in the fifth. He gave up four runs and was taken out needing just one more out to qualify for the win. Manager Buddy Bell wasn't in the mood to do his pitcher any favors, and chose to go to the pen to try to preserve this precious victory.

Mike Wood pitched well to finish the game. Doug Mientkiewicz had a good night, going 2-4 with a double and a triple and one RBI.

We here are Breaking 100 are happy to report that for one of the first times this season, their projections have moved toward the positive side of the ledger.

The Bell Curve


Actual Record: 3-13
Runs Scored: 62
Runs Allowed: 110
Projected Record: 29-133
Pythagorean Record: 39-123
Pythagorean Winning %: .241

Let's go get 'em.

Game 15 - 4/21/1006

Indians 6, Royals 5

Mark Redman struggled in the first inning, giving up 2 runs, but then settled down and pitched pretty well for 6.0 innings. Redman gave up five hits with 5 strike outs and 3 walks.

The Royals offense seemed to awaken a bit in this game. Mike Sweeney broke out of his slump going 4-5 with two doubles. The first double he hit was down the left field line, and it hit the top of the fence missing a home run by just a few feet. His second double in the ninth was a monster shot to left center that was out of the ball park. Except it returned to the park when left fielder Jason Michaels leaped over the wall and catch the ball. The ball left his glove on the way down and rolled into left field, leaving Sweeney with a double. Manager Buddy Bell came out to argue the call saying the ball hit behind the wall and bounced back, but it appears the umpires made the right call.

The Indians led 3-0 in the sixth and the Royals were able to tie it up. As has been the case several times this season, they immediately gave up runs to get back to in a hole. The Royals continued to hit the ball throughout the game, but could never string enough together to get some runs.

Trailing 6-3 in the bottom of the ninth, the Royals finally were able to get some runs across, but fell just short, losing 6-5.

The Bell Curve


Actual Record: 2-13
Runs Scored: 51
Runs Allowed: 105
Projected Record: 20-142
Pythagorean Record: 31-131
Pythagorean Winning %: .191

Let's go get 'em.

Sunday, April 23, 2006

Sweeney

If you're interested, please check out my personal blog to read about my family's time with Mike Sweeney last Friday.

Oh, and it's nice to get a winning streak going, isn't it? :)

Let's go get 'em.

The Streak Ends...

Some good things are happening this weekend. First, Mike Sweeney seems to be busting out of his slump finally. Friday, he went 4-5 with two doubles that were very nearly homeruns. I'll write more about it on my personal blog soon, but my family had the opportunity to spend Friday afternoon with Sweeney. I like to think my son gave him some pointers that helped. :)

And then tonight, the streak finally ended. The Royals got a nice 11-5 victory over the Indians to finally end that 11 game losing streak.

The Bell Curve and projections will be updated Sunday evening to reflect the Indians games.

Let's go get 'em.

Friday, April 21, 2006

Breaking 100: Glass Makes his Statement

There's a glimmer of hope for frustrated Royals fans. In today's Kansas City Star, David Glass is quoted as saying, "We are not willing to wait to see if it gets better."

He also said "If it doesn't turn around, we'll have to change things. We can't wait too long. I'm not willing to go through a season like we did last year. None of us are."

This is the first real indication from Glass that he truely wants to avoid a 100-loss season. If he's going to shake things up, it surely would start with GM Allard Baird. I believe Baird is a good person and a great baseball scout. But it's just not working as a GM. Since Baird took over in June of 2000, the Royals are 370-551. Despite his best efforts in rebuilding the team, the Royals major league team is the worst in baseball, and there isn't a lot of depth in their farm system. At this point, there is no real indication of progress with Baird's plan.

Things have gotten so bad that even eternally positive columnist Joe Posnanski took a break from his break (he was taking 6 weeks off to complete a book on Buck O'Neil) to write about the Royals. He was right to the point:

"The Royals have to fire Allard Baird." He concluds with "...There's really no way around this. It just has to happen."

Let's go get 'em.

Thursday, April 20, 2006

Game 14 - 4/19/2006

Royals 0, White Sox 4

It's not enough that the pitching is a wreck. The Royals' lead the majors in ERA at 6.77.

And it doesn't help that the defense has broken down. Doug Mientkiewicz's error helped lose a game in Tampa Bay, and Berroa's blunder contributed to a loss in Chicago.

But now, the offense has disappeared. The Royals were nearly no-hit yesterday against Javier Vazquez. The losing streak stands at 10. The Royals allowed 69 runs over their 9 game road trip - an average of nearly 8 runs per game.

Unless things change drastically soon, we could be looking down the barrel of an historically miserable season.

The Bell Curve


Actual Record: 2-12
Runs Scored: 46
Runs Allowed: 99
Projected Record: 23-139
Pythagorean Record: 29-133
Pythagorean Winning %: .178

Let's go get 'em.

Tuesday, April 18, 2006

Game 13 - 4/18/2006


Royals 1, White Sox 4

First, the bad news. The Royals lost again, pushing their losing streak to 9 games and their record to 2-11. The Royals could only muster one run even though they were able to get 7 hits. Angel Berroa again muffed a routine play, a trait that has frustrated the Royals for the last two seasons. That error lead to 3 unearned runs.

Now the good news. Jeremy Affeldt actually pitched well, giving up just four hits in six innings. He walked three and struck out three. More importantly, he got throught the first inning without giving up any runs. Berroa's blunder aside, it was a well played game by the Royals. Okay, Berroa's blunder and the fact that they couldn't string thier hits together to score some runs.

One more chance tomorrow to salvage one game of this dismal road trip.

I should also mention that rumor has it that Zack Greinke has reported to Surprise, AZ to begin his spring training. Hopefully, the rotation will have help on the way.

The Bell Curve


Actual Record: 2-11
Runs Scored: 46
Runs Allowed: 95
Projected Record: 25-137
Pythagorean Record: 31-131
Pythagorean Winning %: .190

Let's go get 'em.

Breaking 100: What Youth Movement?

Royals fans are getting impatient. And who can blame them? For more than 5 years, the Royals have been executing on a “youth movement,” in efforts to create a competitive baseball team by drafting and otherwise acquiring young talent. In some cases, the youth movement involved rushing players to the majors well before they were ready.

The result of this plan has been several 100-loss seasons, broken up by one winning season – the fluke of 2003. The Royals felt that in 2004, they could compete by simply plugging a few holes. They signed a couple of aging free agents who broke down and the team spiraled to a dismal 58-104 record. In 2005, the team recommitted itself to the youth movement and played many young players. Fans were told to expect many losses while the team evaluated their talent. The Royals finished 57-105.

Royals GM Allard Baird said after the 2005 season that “Phase I” of the plan had been completed. He said that in “Phase I,” the Royals were evaluating their youngsters to determine which ones to build their team around. “Phase II,” we were told, was to plug some holes with veterans in an effort to start winning games some games (which, sounds eerily familiar to the 2004 strategy).

Just like 2004, the Royals have gotten off to a dismal start in 2006. The current team features a mix of young players along with some veterans, and very few wins. The Royals continue to be the laughing stock of MLB. The local sports radio station is dedicating their entire day of programming to “Royals Venting,” and there is no shortage of callers.

Kansas City has always been a great baseball city. The citizens of Jackson County just passed a sales tax to pay for extensive stadium improvements for both the Chiefs and the Royals. The fans still care and are still passionate. They want to cheer a winner.

Baird’s contract expires this season, and he has not yet been offered an extension. Given the pattern that is playing itself out, it’s hard to believe that Baird would survive this. Could a new General Manager make a difference? Is the organization is such poor shape that not even the best of GM could fix it? The young talent that the organization has acquired has been mostly disappointing. How many years would it take to turn it around?

And will Royals fans still care?

Let’s go get ‘em.

Monday, April 17, 2006

Game 12 - 4/17/2006

Royals 0, White Sox 9

91. That's how many runs teams have scored against the Royals this season. Royals pitchers are giving up an average of 7.5 runs per game. It doesn't matter how good your offense is, you cannot win baseball games when you give up 7.5 runs per game. Toss in the fact that the Royals have only scored 45 runs themselves, and you have yourself a 2-10 record and a nice 8 game losing streak.

Joe Mays threw batting practice for 5.1 innings. The 5 runs he gave up in the first inning ended the game just minutes after it started. He gave up 11 hits, 8 runs (6 earned) and struck out five. On the positive side, he only walked one batter, and he actually looked decent after that first inning.

When Mays faltered in the sixth, Buddy Bell called on newly promoted reliever Joel Peralta. Peralta was called up after Stemle complained of a sore elbow and landed on the DL (curiously, on the same day that he was sure to be sent down to the minors). I noticed that the ball seemed to have a lot more "zip" or "life" to it than the balls that Mays was throwing up there. I also liked seeing Peralta talking to himself and getting fired up after giving up a walk. It's nice to see a pitcher out there who actually seemed to want to compete.

Peralta gave up two walks, and one of those was cashed in. Gobble pitched a perfect eighth, lowering his ERA to 15.43.

Meanwhile, the Royals could not get anything going offensively against Jose Contreras. They only had 2 base runners all night (A Grudzielanek hit and a Buck walk). Grudz actually made it to third base but could not get home.

The losing streak stands at 8 and the Pythagorean Record takes another beating. Royals fans are expecting the streak to hit 9 games after Jeremy Affeldt makes the start tomorrow night.

The Bell Curve

Actual Record: 2-10
Runs Scored: 45
Runs Allowed: 91
Projected Record: 27-135
Pythagorean Record: 32-130
Pythagorean Winning %: .196

Let's go get 'em.

Sunday, April 16, 2006

Game 11 - 4/16/2006

Devil Rays 9, Royals 5

Mark Redman made his Royals debut, and pitched five "so-so" innings. He struggled with his control and it was obvious he was still knocking some rust off. In his five innings, he gave up 7 hits and 3 runs. He struck out 3 and walked 3.

Steve Stemle relieved Redman and was blasted for 6 runs. Stemle was easily the worst pitcher I saw in Spring Training this year, and I still don't understand how he made the roster over Joel Peralta or Steve Andrate.

To as injury to insult, Denny Bautista (yes, the one and only effective pitcher on our staff) was placed on the DL for a pectoral muscle strain.

We here at Breaking 100 usually look forward to April with such anticipation because it marks the beginning of another baseball season. We always feel so optimistic in the cold of January, February and March. But, alas, before tax day hits, we always end up with this sick feeling in the pit of our stomachs.

What does it take to get this team off to a decent start? Even somewhat respectable? Something better than sub-.200 baseball?

Happy Easter.

The Bell Curve


Actual Record: 2-9
Runs Scored: 45
Runs Allowed: 82
Projected Record: 29-133
Pythagorean Record: 37-125
Pythagorean Winning %: .231

Let's go get 'em.

Game 10 - 5/15/2006

Royals 3, Devil Rays 6

Mike Wood stepped in to make a spot start to cover for the still missing Runelvys Hernandez. As expected, Wood didn't last long since he's not been working as a starter this season. He left after four innings, giving up 2 runs and 3 hits. Continuing the theme for this road trip, Wood walked five of the 8 Rays that were given free passes. Luke Hudson then came in and gave up 3 runs, putting the game out of reach.

It is being demonstrated daily that this Royals team has absolutely no pitching. None.

Meanwhile, Sweeney's slump (to put it kindly) continues as his AVG dips to .107.

The Bell Curve

Actual Record: 2-8
Runs Scored: 40
Runs Allowed: 73
Projected Record: 33-130
Pythagorean Record: 37-125
Pythagorean Winning %: .231

Let's go get 'em.

Saturday, April 15, 2006

Game 9 - 4/14/2006


Royals 2, Devil Rays 7

When I started this blog, I honestly and sincerely believed that this Royals team, even with all of its warts, would avoid 100 losses. I really believed that the bad luck and bad talent that has plagued this team for so long would subside, if only for a season. But, 9 games (I know, small sample size) into the 2006 season, and things look no different. The Royals lost another ugly game last night in an ugly ballpark.

The Royals were not getting anything going offensively, but were able to grab a 2 run lead in the fifth inning. Scott Elarton pitched well enough to hold the Rays scoreless into the sixth. But Elarton must have tired as he loaded the bases, forcing Buddy Bell to call in the savior, Elmer Dessens. Only this time, the savior didn't save. Dessens finally began his regression, giving up four runs in an inning and two thirds. Perhaps now those Royals fans who were so angry that Dessens didn't pitch more in New York can take comfort in knowing that Dessens is, in fact, a Royals pitcher.

In order to keep a positive spin on this season, the Royals PR machine continues to crank out optimistic information about the near future. In today's Kansas City Star, the big heading story on the Sports Daily page reads, "GREINKE EAGER TO PITCH AGAIN." This is of course good news given the abysmal pitching the Royals have gotten so far this season. However, in reading the story, we find out that he may not return until late June or even July. Well, at least they're giving us something to hope for.

And in a classic "I told you so" (for Royals fans, at least) move, the struggling Jeremy Affeldt has been demoted to the bullpen. The Royals won't call it a demotion, saying instead that they just need some relief in the pen because they have been overworked (thanks in part to Affeldt). Mark Redman will rush back to the team to make his first start tomorrow. So, this tells us that Buddy Bell sees the same pitching issues that we see, and he is trying to shake things up a bit.

Finally, on a less positive note, looking at the total runs scored and runs allowed for the Royals, we can see that they are digging themselves a big hole. They already have a 30 run deficit which means the Pythagorean formula will not be kind to them for some time to come. The Royals need a couple of nice fat blow out wins in order to allow us to project them breaking 100.

The Bell Curve


Actual Record: 2-7
Runs Scored: 37
Runs Allowed: 67
Projected Record: 36-126
Pythagorean Record: 38-124
Pythagorean Winning %: .235

Let's go get 'em.

Friday, April 14, 2006

"Drive for show, putt for dough"

This familiar saying about golf encompasses baseball as well. In golf, striking a huge drive will get lots of “Ooos” and “Ahhs” from the crowd, but you won’t get a check until you put the ball in the hole.

With baseball, it’s the offense that most commonly draws the excitement of the crowd. In the “lively player era,” falling home run records had baseball fans scrambling to the ball parks. But did Barry Bonds win a World Series?

It’s pitching and defense that earns wins and dough in baseball.

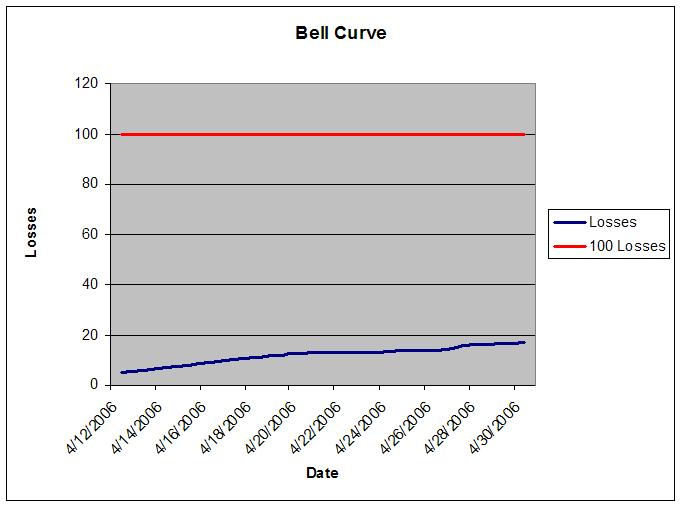
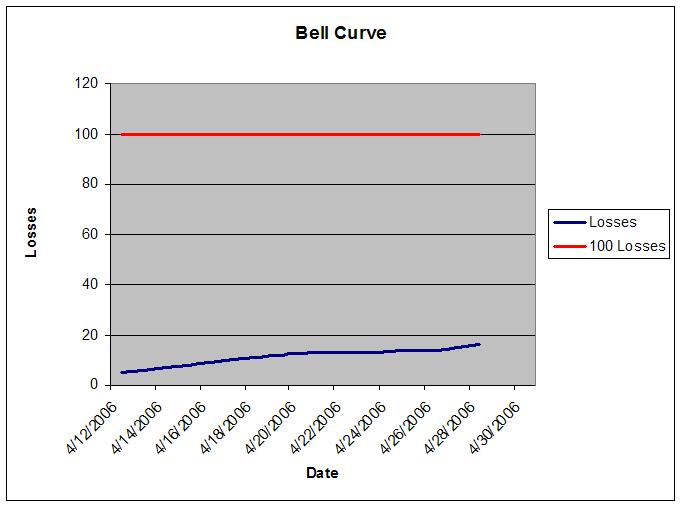
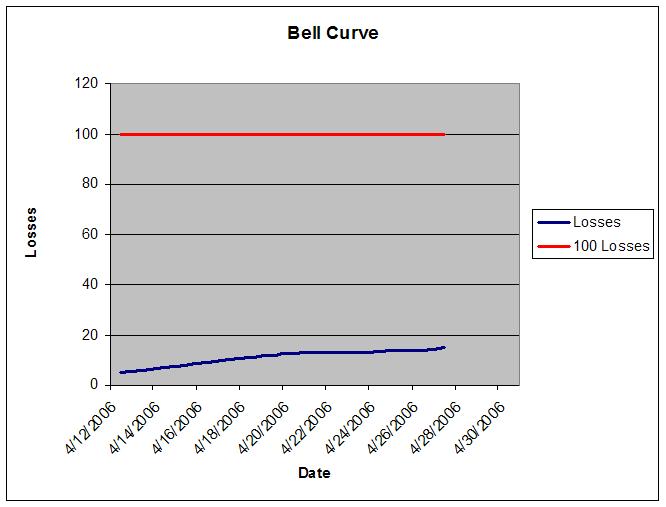
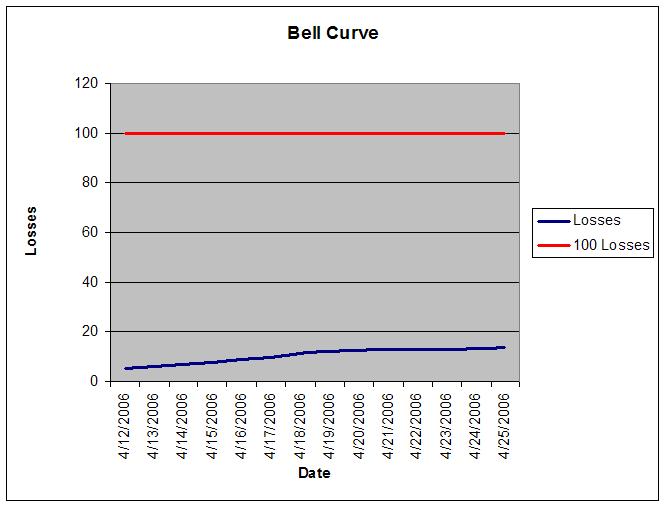
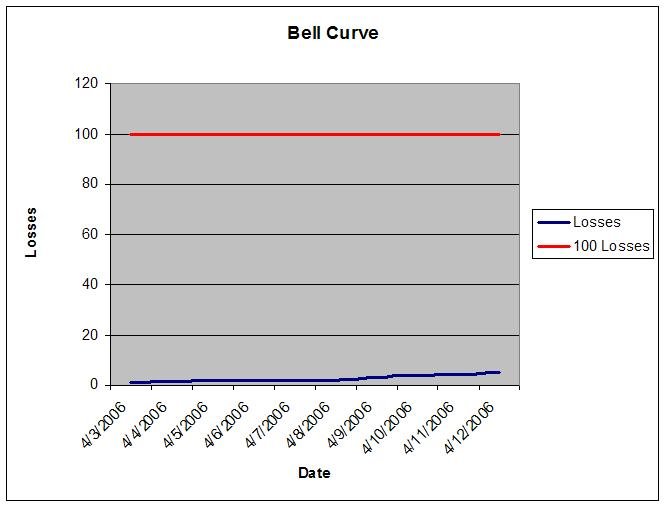
Unfortunately, we here at Breaking 100 see a disturbing trend. Right now, the Royals have no pitching. They will most certainly lose 100 games this season if they don’t get their pitching figured out.

The sad part is, it seems everybody has known about the Royals’ pitching problems for years except for the Royals. In yesterday’s Yankees game, The Royals were still in the game in the eight, trailing 4-2. Jimmy Gobble entered the game and promptly gave up 5 hits, 5 runs 1 walk and 1 strike out (more on this in a moment). His ERA now stands at a svelte 24.00.

If we take a peek at some recent history, we can see that there have been warning signs about some of these pitchers. In the case of Gobble, he has always had a low strike out rate, which is not a good indication of success in the big leagues. Dan Fox wrote about Gobble in August of 2004. Dan ended his comments with “I would trade him as soon as possible.” Here we are in 2006, and Gobble is providing no value.

Jeremy Affeldt made the starting rotation this year. In the past 3 years, Affeldt has been about as consistent as the weather in Kansas City. Add in the injuries, and the Royals had a pitcher who hasn’t contributed much to this team. But as a lefty with a mid-90’s fastball, he is also a pitcher with some value on the market. They should have traded him a year or more ago.

We can even point to the “sure thing,” Zack Greinke. In the 2005, Baseball Prospectus said of Greinke, “…we have seen the future of pitching, and his name is Zack Greinke.” I respect the writers at BP a great deal, but there has always been a question as to whether Greinke could ever really become a dominant pitcher. Again, Dan Fox, examined Greinke and his “old pitcher skills.” Bill James has never been too keen on Greinke. The reason is that while he is a very intelligent pitcher, he just doesn’t possess the skill to dominate. Without an “out” pitch, Greinke relies instead on changing speeds and deceit. These are the strategies typically employed by older pitchers when they’ve lost velocity. So to pin all of your hopes and dreams on this high school pitcher, who we now know also has some emotional issues, was foolish.

The Royals “lead” the AL in ERA, which now stands at 7.57. Here’s a peek at the 2006 Royals “shock and awe” campaign:

Name

G

IP

ERA

Wood

3

4.1

8.31

Stemle

4

3.2

9.82

Mays

2

7.0

12.86

Affeldt

2

7.1

14.73

Sisco

6

4.0

15.75

Gobble

4

3.0

24.00

Do any of those performances surprise you? Perhaps Wood, who pitched very will in Spring Training. Well enough to deserve a spot in the rotation. Stemle was terrible in Spring Training. Mays was terrible in 2005 coming off Tommy John surgery. Affeldt and Gobble have well documented problems. Sisco is still young and should probably be at AAA.

Is there hope for the future as we look to break 100? Perhaps Mark Redmond will return from his injured knee and put up some decent performances. It has been said that Greinke may be working toward his return soon. Will he pitch like the Greinke of 2004 (good), or the one of 2005 (not so good).

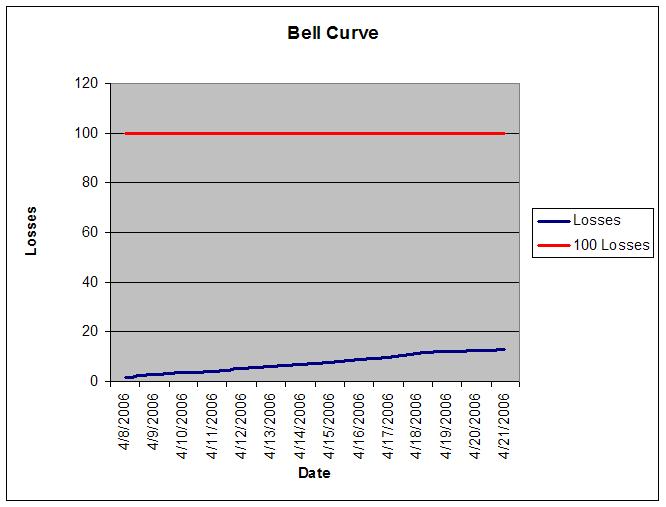
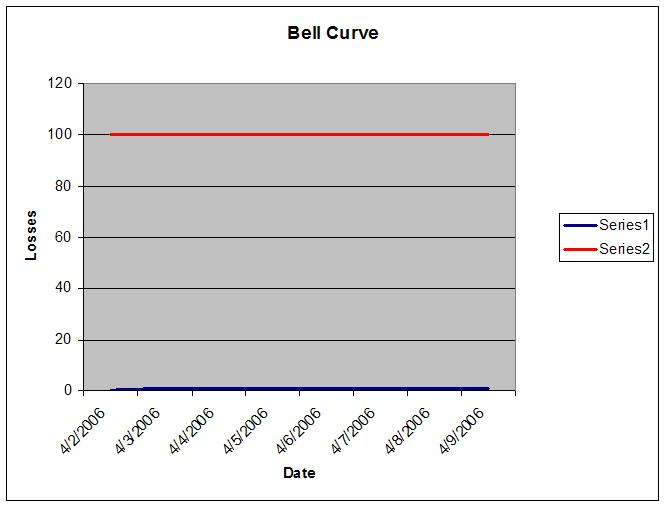
Only time will tell, but 8 games into the season, the blue line is racing toward the red line too quickly. A reverse of fortune on the mound must occur to avoid the inevitable.

Let's go get 'em.

Thursday, April 13, 2006

Game 8 - 4/13/2006

Royals 3, Yankees 9

Well, the good new is that Royals pitchers only gave up one walk. The bad news is that the Yankees' lineup is just too strong. Bautista had a decent outing, walking 1 and striking out 7. He gave up 6 hits and 4 runs in 5 innings, which isn't surprising against the Yankees.

Andy Sisco had a decent outing as well, hopefully on his way to recovering from his slow start.

The Bell Curve


Actual Record: 2-6
Runs Scored: 35
Runs Allowed: 60
Projected Record: 41-121
Pythagorean Record: 41-121
Pythagorean Winning %: .254

Let's go get 'em.

Game 7 - 4/12/2006

Yankees 12, Royals 5

Ugh... This pitching rotation is in shambles. Runelvys Hernandez was projected to be in the rotation. He's in Omaha getting shelled as he tries to lose weight. Mark Redmond was projected to be in the rotation. He's in Wichita trying to rehab his knee. Zack Greinke was projected to be in the rotation. He's in Orlando trying to get his head on straight. Joe Mays was projected to be in the rotation. He is, but he's gotten blasted in his two starts. Jeremy Affeldt was projected to be in the bullpen. He made the rotation because of the injuries, but has gotten killed in his two starts.

The only bright spots on this pitching staff are Denny Bautista, Scott Elarton and Elmer Dessens. Every other pitcher has looked mediocre at best this season.

Royals pitching has given up an average of 7.2 runs per game. The Royals offense has looked okay at times, but they've only managed to score an average of 4.5 runs per game. That defecit not only hurts their actual record, which now stands at 2-5, but it also does not bode well for the future. Their projected record has now dipped to 46-116, based on the Pythagorean Formula.

What can be done to correct this? One postive step might be to actually throw strikes. In the two games against the Yankees, Royals pitchers have walked 17 batters. That's a lot of base runners.

Bautista gets the start Thursday against Randy Johnson. Even though he looked good, giving up just one hit, Bautista also walked five in his first start. He cannot afford to be that wild against the Yankees' lineup. If he throws strikes and doesn't force his offense to crawl from behind, perhaps the Royals can still salvage one in the Big Apple.

The Bell Curve

Actual Record: 2-5
Runs Scored: 32
Runs Allowed: 51
Projected Record: 47-115
Pythagorean Record: 46-116
Pythagorean Winning %: .282

Let's go get 'em.

Tuesday, April 11, 2006

Game 6 - 4/11/2006

Royals 7, Yankees 9

Heading into New York, we were hoping to at least take one of the three games. Today, the Royals had the perfect opportunity to grab that one win when they led the Yankees 7-4 in the eighth inning.

Elmer Dessens was absolutely unhittable in his two innings of work. Instead of leaving him in to work the eight, manager Buddy Bell stuck to his formula and brought in Andy Sisco to pitch the eighth. Sisco promptly gave up 2 hits, and 2 walks. He was charged with 4 runs after Burgos game in and gave up a homer to Jeter.

I'm not going to pretend to be smart enough to know whether Bell should have left Dessens in there. There were left handed pitchers due up, so it made sense to have a lefty on the mound. But Sisco has struggled this season, and with the opportunity to grab a win in New York and with Dessens mowing them down, maybe it would have made sense to leave him in there.

Instead, the Royals have now lost 12 straight in Yankee Stadium. We were hoping for one win in New York. It will be up to Jeremy Affeldt (who struggled in his previous outing) or Denny Bautista (who looked great, but will face Randy Johnson).

Offensively, the Royals looked promising. They fought back from an early deficit. Sanders and Costa both homered, and everybody else seemed to hit the ball hard.

The Bell Curve


Actual Record: 2-4
Runs Scored: 27
Runs Allowed: 39
Projected Record: 53-109
Pythagorean Record: 52-110
Pythagorean Winning %: .324

Monday, April 10, 2006

Breaking 100: Will the defensive changes help?

In the last off-season, Royals GM Allard Baird made several moves to improve the defense. In 2005, the Royals defense was awful. They led all of Major League Baseball with 125 errors. One could argue that the pitchers struggled because of this because they were afraid to pitch to contact. Errors are of course a very subjective stat, and don’t include what Bill James calls “defensive misplays.” (For more about defensive misplays, check out “The Fielding Bible” by John Dewan)

I just did a quick comparison to see if the Royals’ new defense might net a few wins over last year. For this quick study, I used
Baseball Prospectus’s Defense stat which measures the number of runs the player saves compared to the average for their position. If a player has a zero Defense, they are exactly average for their position. Anything above zero indicates a better than average defender, below zero indicates a below-average fielder.

Accumulating each 2005 Royals player individually, the total Defense stat came to -43. That’s 43 runs below average. This means that if the Royals had fielded average defenders, they would have allowed 43 fewer runs to score over the season. Approximately 10 runs equal a win, meaning the Royals would have lost about 102 instead of 106 in 2005.

Replacing 2005’s Royals with the new players and using each player’s 2005 Defense stat, the total comes to -33. That’s still a below average defense, but is 10 runs better than the 2005 team. Unfortunately, that only equates to 1 win. The biggest problem in this scenario is that the Royals’ worst defenders from 2005, Emil Brown and Angel Berroa, are still on the team. The other poor Defense player, Terrence Long, is thankfully long gone.

This is of course a very rudimentary comparison and probably doesn’t accurately project the 2006 Royals Defense. But, at the very least, it allows us to plug different players into the defense to see their affect on the overall season.

If the defense gives us 1 more win this year, perhaps the offense and pitching can make up the other 5 games? We’ll take a look at that in future articles.

Let’s go get ‘em.

Sunday, April 09, 2006

Game 5 - 4/9/2006


White Sox 3, Royals 1

The good news is that Scott Elarton has pitched two straight great games. The bad news is that the Royals can't seem to hit a lick when Elarton's on the mound. Just like Opening Day, the Royals lost 3-1. The Royals couldn't do anything offensively against Mark Buerle, and some critical base running mistakes didn't help matters much. The Royals were able to get a run in the ninth when Reggie Sanders hit his first home run as a Royal.

An off day tomorrow, the Royals then travel to New York to face the Yankees for three afternoon games. As long as Edurado Villacis isn't anywhere in sight, I still feel good about this year's Royals team.

The Bell Curve

Actual Record: 2-3
Runs Scored: 20
Runs Allowed: 30
Projected Record: 65-97
Pythagorean Record: 50-112
Pythagorean Winning %: .308

Let's go get 'em.

Saturday, April 08, 2006

Game 4 - 4/8/2006

White Sox 3, Royals 4

The Royals reached .500 today with a great performance today against the White Sox. Denny Bautista pitched well, going 6 innings allowing just one hit and one earned run. Bautista was a little wild, walking five, but also got five strike outs including a couple that made AJ Pierzynski look silly.

The Royals had some difficulty getting things going offensively against Javier Vasquez. They were able scratch two across to take the lead in the sixth on Reggie Sanders' double.

Luke Hudson relieved Bautista in the seventh and preserved the lead. Andy Sisco came into the game in the eighth and struggled, giving up two runs and the lead. Elmer Dessens put a lid on the Chicago rally by enducing a double play to end the inning.

Mike Sweeney had another tough day and the boo-birds were out in force. He struck out twice, and was then hit by a pitch. But he silenced his detractors by driving a ball through the wind into the left field seats to give the Royals the lead.

Ambiorix Burgos pitched a 1-2-3 ninth to notch the save and give the Royals the win.

So the good news is that the Royals are now .500, but unfortunately they are giving up too many runs and not scoring enough runs. Their Pythagorean Record still shows them losing 108 games. They will go for the sweep tomorrow.

The Bell Curve


Actual Record: 2-2
Runs Scored: 19
Runs Allowed: 27
Projected Record: 81-81
Pythagorean Record: 54-108
Pythagorean Winning %: .331

Let's go get 'em.

Game 3 - 4/7/2006

White Sox 7, Royals 11

The Royals notched their first win in the wind last night. Jeremy Affeldt looked awful in the first, but then settled down. The Royals' offense came alive as they pushed 11 runs across. It still wasn't enough to get their Pythagorean record past the 100 loss mark, but it is progress. We'll be there today as Denny Bautista tries to shut down the White Sox.


The Bell Curve
Actual Record: 1-2
Runs Scored: 15
Runs Allowed: 24
Projected Record: 54-108
Pythagorean Record: 46-116
Pythagorean Winning %: .281


Let's go get 'em.

Thursday, April 06, 2006

David's Glass: Half Full or Half Empty?


While reading the posts over at
RoyalBoard, I got the impression that some Royals fans aren’t feeling too confident about the Royals breaking 100 this year. This is undoubtedly a result of enduring year after year of ineptitude. These fans have watched a lot of bad baseball over the years, and are definitely bitter because of it.

If your team just won the World Series the year before and then lost the second game of the season 14-3, you’d probably just brush it off as a bad day and look forward to the next series.

If your team had lost 389 games over the previous 4 seasons and lost that second game 14-3, you’d suddenly feel as if all was lost. Understandable.

But we here at Breaking 100 are all about the positive. Even though the Royals are on a pace to lose 154 games (according to Bill James’s Pythagorean Formula), we still hold out hope that they will win at least 63 games. All is not yet lost, since it indeed is very early in the season. Additionally, while the Royals did look awful in game 2, their Opening Day performance wasn’t really that bad. They didn’t hit, but the pitching and defense were good enough to win on a lot of nights.

The old time baseball guys like to say that teams will win 50 games and lose 50 games. It’s what happens in the other 62 that make or break a team. Two games in, we can say that the Royals still have 48 games of play in the loss column. There’s still plenty of time to put together a respectable season. In fact, the Royals could be .500 (a very respectable mark) by the end of this weekend.

Unfortunately, the schedule makers didn’t do the Royals any favors. The White Sox come to Kansas City for a three game weekend series. The Sox are off to a slow start, having lost 2 of 3 to the Indians, so they will be eager to win some games. The Royals then will head to New York to face the Yankees for three games, followed by a trip to Tampa Bay and to Chicago for a rematch against the White Sox.

We can project a couple of scenarios for the next week or so. The pessimistic (possibly realistic) view has the Royals playing more like their game 2 performance, having them come off their road trip with a record around the 2-12 mark. Ugh.

More optimistically, let’s say the White Sox are still having trouble getting into gear and Jeremy Affeldt and Denny Bautista pitch well and the Royals take 2 of 3, giving them a 2-3 record overall. In New York, we’ll say they lose 2 of 3 and then take 2 from the Devil Rays. This would give them a 5-6 record heading to Chicago. Assuming Chicago’s getting things going by next week and they take two of three, the Royals could head home with a 6-8 record. Certainly, that’s a record that should provide enough hope to Royals fans to want to head out and catch a few games of their long home stand at the end of April.

It may even cheer up a poster or two over at RoyalBoard. Though I’m not too optimistic about that.

Let’s go get ‘em.

Wednesday, April 05, 2006

Game 2 - 4/5/2005

Tigers 14, Royals 3

Today’s Bell Curve took a major turn for the worse. The Royals lost 14-3. Since the Pythagorean Formula is based on runs scored and runs allowed, it fell drastically to .052 which translates to a projected record of 8-154. That’s well over the 100-loss barrier we’re trying to avoid.

Things got off to a bad start with Joe Mays struggling in the first inning. Again, the opposing pitcher looked like Cy Young against the Royals' bats. The Royals were only able to scratch out 3 runs on 6 hits while the Tigers exploded with 14 runs on 19 hits. The Royals also pitched in with 2 errors. Things got really ugly in the ninth when Mike Wood gave up two homeruns. He followed the second homer by hitting the batter and getting himself ejected. Ugly.

Another off day tomorrow, then the World Series champion White Sox come to town. We’ll be at the game on Saturday. If nothing else, at least we can look forward to getting a Royals wristband when we walk in the gates.

The Bell Curve

Actual Record: 0-2
Runs Scored: 4
Runs Allowed: 17
Projected Record: 0-162
Pythagorean Record: 8-154
Pythagorean Winning %: .052

Let's go get 'em.

Breaking 100: An Historical Review

By Dan Fox

Breaking 100…hmmm….as I thought about this blog and its quest to see the Royals wind up with only 99 losses, what immediately came to mind was the historical question as to how frequently does a team that loses 100 games in one season loose fewer than 100 the next? And what might that mean for the Royals?

Some quick queries using the excellent Lahman database yielded the following answers:

Since 1901 there have been 129 teams that have lost 100 games. The average winning percentage of those teams was .334 equivalent to a 54-108 record in a 162 game season The most recent 100-loss seasons (since 2000) include:

YearTeamLgWLPct
2001TBAAL621000.383
2001PITNL621000.383
2002TBAAL551060.342
2002DETAL551060.342
2002KCAAL621000.383
2002MILNL561060.346
2003DETAL431190.265
2004ARINL511110.315
2004KCAAL581040.358
2005KCAAL561060.346

Of the 128 teams 35 of them or 27% lost 100 games the following year. That seems like pretty good news for Breaking 100 since historically it would appear that losing 100 games one season does not mean that you’ll lose 100 the next. Excellent news for Breaking 100.

Hold on though…

In the following season for those 128 teams (since we won’t include the 2005 Royals) the teams averaged a winning percentage of .405 or a 66-96 record over 162 games. So teams that lost 100 didn’t exactly become world beaters. Probably the largest single explanation for the 12 game improvement is the “Plexiglas principle”.

This principle as defined by Bill James in the 1982 Baseball Abstract says that

“all things in baseball have a powerful tendency to return to the form which they previously held. If a player's batting average jumps in one year, it will usually decline in the next. If his HR total drops sharply in one season, bet on him to improve it the next."

Essentially this means that players and teams tend to regress towards the mean because the element of chance tends to even out. Teams that lose 100 games do so not only because they’re bad, but also because they’re unlucky. In 2005 the Royals scored 21 fewer runs than predicted by the sum of their offensive elements, gave up 19 more runs than would have been expected given their defensive statistics, and won 4 fewer games than would have been expected given their ratio of runs score to runs allowed. In total, when evening out these factors (which can loosely be correlated with luck) the Royals “should” have won 64 games (http://www.hardballtimes.com/main/article/second-look-at-luck/).

The other reason that teams who lose 100 games one season usually don’t do so the next is simply that losing 100 games comes close to the wall of how many games a team can reasonably lose and still be in the major leagues. Most analysts agree that even if you had a team populated with replacement level players (players you can sign for the league minimum and that are therefore “freely available” talent) you would still win somewhere between 40 and 50 games. Simply having a handful of major leaguers above replacement level gets a team to 55 or more wins.

That said, the Royals of 2005 were among the 27% as they went from 104 losses in 2004 to 106 in 2005.

But we’ll end with a happier note and list those teams that performed the best after their 100 loss season.

YearTeamLgWLPct
1905PHINL83690.546
1967CHNNL87740.540
1989BALAL87750.537
1974TEXAL84760.525
1918PITNL65600.520
1986CLEAL84780.519
1980OAKAL83790.512
1986SFNNL83790.512
2003KCAAL83790.512
1947PHAAL78760.506
1963CHNNL82800.506
1962PHINL81800.503
1909NYAAL74770.490
1971CHAAL79830.488
1990DETAL79830.488
1997DETAL79830.488
1994NYNNL55580.487
1988CLEAL78840.481
2005ARINL77850.475
1992CLEAL76860.469


What you see here is that a best case scenario for any team would be around 85 wins but the 2003 Royals (“We Believe!”) came in 9th.

Let’s go get ‘em!

Monday, April 03, 2006

Game 1 - 4/3/2006


Tigers 3, Royals 1

The Royals kicked off their 2006 season on a glorious, but cool afternoon against the Tigers at Kauffman Stadium. Breaking 100 took in the game from the top of the upper deck, right behind home plate. We weren't close enough to evaluate Scott Elerton, but the scoreboard didn't lie. He pitched well, giving up just 2 runs in 5 2/3 innings. He scattered 7 hits and gave up the two runs on two solo homers by Chris Shelton. The second homer barely reached the seats just inside the right field foul pole.

If you ask the Royals (or just about any Royals fan), they'd probably take a 2-run performace in 5 2/3 innings. Unfortunately, Elarton's decent outing was negated by Kenny Rogers. The Royals have always struggled against the Gambler, and today was no different. The Royals did scratch a run across on Reggie Sanders's RBI single in the fourth inning.

Overall, it wasn't a bad outing for the Royals. The bats were stifled by good pitching, but the defense looked better behind acceptable pitching by Elerton, Andy Sisco, and Ambiorix Burgos.

In Opening Week tradition, the Royals will rest Tuesday and take on the Tigers again on Wednesday.


The Bell Curve


Actual Record: 0-1
Runs Scored: 1
Runs Allowed: 3
Projected Record: 0-162
Pythagorean Record: 16-146
Pythagorean Winning %: .100

Today's Bell Curve doesn't look good, but with a one game sample size, it's not surprising. The Royals scored just one run while giving up three, which projects to a .100 winning percentage using Bill James's Pythagorean Formula.

Let's go get 'em.

Play Ball!


It's finally Opening Day. Here's hoping the Royals can notch the first of at least 63 wins this year. Go Royals!

We'll be there this afternoon, and the inagural Bell Curve will be up later this evening.

Let's go get 'em.