
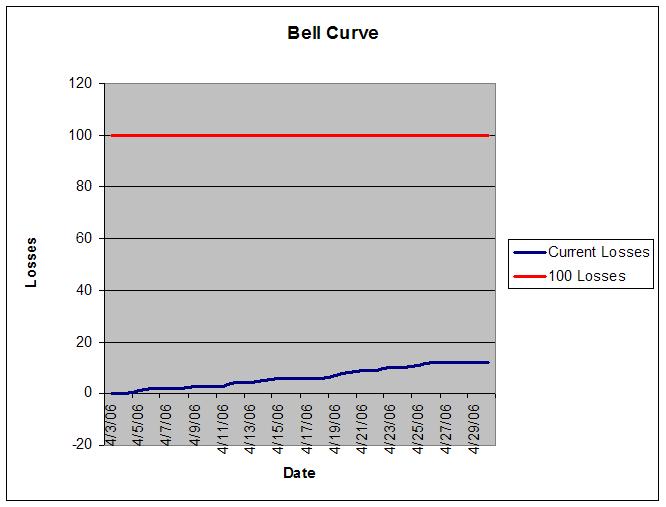
Each day, Breaking 100 will present the “Bell Curve.” This graph will show the current losses on the season, with a red-line limit set at 100. We’ll also project the Royals’ record along with a Pythagorean projection. Hopefully, The blue line of the Bell Curve will never touch the red line.


No comments:
Post a Comment